COMPARISON OF STARR LIFE SCIENCES’ MOUSEOX® PLUS AND KENT SCIENTIFICS’ MOUSESTAT® PULSE OXIMETERS
Addendum A to: Validation of the MouseOx® Plus Arterial Oxygen Saturation Measurements (Strohl et al., 2007)
Case Western Reserve University, September 1, 2016
Jennifer Gamble, Registered Veterinary Technician; David Nethery, Senior Research Associate, Kingman P. Strohl, Professor of Medicine, Physiology and Biophysics
Click here to download the PDF of this whitepaper1. Introduction
Pulse oximetry is the fifth vital sign in human health and has become useful in animal research for monitoring and for planning of cardiopulmonary studies in anesthetized and conscious models. A pulse oximeter continuously and noninvasively measures functional arterial blood oxygen saturation (SpO2). Pulse oximetry is noninvasive, and, compared to an arterial blood draw through needle puncture or indwelling catheter, reduces the risk of complications such as trauma, infection and discomfort to the patient or subject. Also risk to the experimenter from needle stick, time, and cost of consumable items are reduced or eliminated. When referring to subjects as small as laboratory mice and rats, loss of blood from blood samples can introduce additional hemodynamic and reflex variables to the model as well as compromise overall health.
Continuous pulse oximetry, now a standard anesthesia/surgical monitor for humans, has been applied to laboratory animals, and is used in many research monitoring and applications. As a vital signs monitor, pulse oximetry ascertains one critical component of oxygen delivery in experimental subjects and can establish consistency before, during and after experimental procedures, as well as monitor dynamic changes occurring as a result of intent (imposed hypoxia) or circumstance, like induction or maintenance of anesthesia. SpO2 is an important, sometimes primary, reported parameter in areas of research including but not limited to: cardiopulmonary dysfunction, altitude effects, exercise/activity, toxicology, obesity, metabolic studies, etc.
With the use of specially designed cages and tether management pulse oximetry can be used to monitor SpO2 in conscious, freely moving small animals. The plethysmogram (pulsatile waveform) generated by a pulse oximeter and output as an analog signal has been used to provide cardiac-based triggering for use in imaging applications (cardiac gating).
In the applications mentioned above, accuracy and reliability of SpO2 measurements is vital in order to provide an objective measure of the animal’s condition at any given time. The Starr Life Sciences (SLS) MouseOx® Plus was designed specifically to be a research grade pulse oximeter optimized for use on mice and rats. MouseOx® Plus has been calibrated for murine blood, optimized for pulse rates as high a 900 BPM, and has been validated against co-oximetry as the gold standard measurement of SaO2 (Strohl et al., 2007).
Since the introduction of the original MouseOx® Plus in 2006, other pulse oximeters claiming to be effective for use on laboratory mice and rats have emerged. One such product is PhysioSuite® with MouseSTAT® from Kent Scientific (KS)
The purpose of this study is to compare the performance of MouseOx® Plus and MouseSTAT®.
2. Materials
| Computer/Software | Equipment | Sensors | Animals |
|---|---|---|---|
| 2 x PC with Windows® | 1x Starr Life Sciences MouseOx® Plus | 1x STARR Life Sciences Thigh Sensor | 2x White Sprague Dawley Rat |
| 1 x MouseOx® Plus Software (Rev 1.5.10 with recording module) | 1x Kent Scientific PhysioSuite® with MouseSTAT® | 1x STARR Life Sciences Foot Sensor | 2x Black Balb C57 Mice |
| 1x FTDI Chip CDM20814 Driver software | 1x STARR Life Sciences Oxy-Dial | 1x Kent Scientific Mouse Paw Sensor | 2x White A/J mice |
| Serial Port Terminal software (Data transfer MouseSTAT® to PC) | 1x Warming Pad | 1x Kent Scientific Y-Clip sensor | 1x Small animal anesthesia station (Isoflurane) |
| 1x Nova Biomedical Stat Profile PRIME CCS Analyzer |
Table 1 (Materials)
3. Setup
4. Methods
Studies were performed as part of a quality assurance project designed to compare oximeter performance and accuracy. Animals were provided by the Animal Resource Center from those that were identified as being euthanasia candidates because of age or ending of a protocol. No animal was in a drug or surgical procedure. All procedures reported here were non-survival monitoring or surgery, and animals were immediately euthanized by pentobarbital overdose upon completion of the oximetry comparisons.
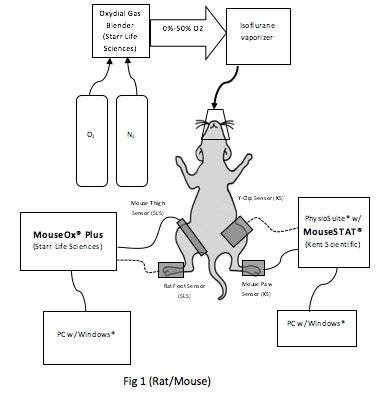
Rats and mice were anesthetized using isoflurane and warmed with a heating pad in order to encourage peripheral blood flow to facilitate oximeter pulsatile measurements. Each animal was initially anesthetized and maintained at a stable steady state using 1.5 LPM of 50%/50% mixture of O2/N2 input to an isoflurane vaporizer set at 1.5%. The MouseOx® Plus and MouseSTAT® sensors were attached on opposite sides of the animal (see Fig 1) and covered with opaque cloth to prevent cross-talk between sensor and mitigated interference from overhead lighting. Data was recorded at 1 Hz sample rate on both pulse oximeters.
Each animal started with a baseline FiO2 of 50% and was then subjected to varying periods of reduced FiO2 in order to induce varying levels of hypoxia. This baseline FiO2 typically induced an SpO2 of 98%-100% as measured by the MouseOx® Plus. To represent how these two systems performed, the results for rats or mice are presented first in regard to static, steady state data and then presented during more rapid changes (dynamic data) as might be seen during anesthesia or in experimental intermittent hypoxia. These short but measurable hypoxic states, with SpO2 as low as 60%, were induced before returning the FiO2 to 50%. Each animal was allowed to recover for at least one minute between hypoxic events, achieving stable signals and SpO2% values on the MouseOx® Plus. Arterial blood gases when performed were collected from an indwelling arterial line (see results for more detail about collection and timing).
The MouseOx® Plus continuously monitors signal quality and flags the data when signal quality is questionable. Signal quality can be adversely affected by poor sensor placement, excess or dark fur, or poor peripheral perfusion caused by excess anesthesia or low body temperature
| Feature Comparison | |||
|---|---|---|---|
| MouseOx ® Plus | MouseSTAT® | ||
| SpO2 Range (%) | 0.0 - 99.9 | 70-100 | |
| SpO2 Resolution | 0.1% | 1% | |
| SpO2 Accuracy | +/- 2% | 80%-100% | - (No data given) |
| +/- 4% | 30%-80% | ||
| Insufficient data | 0%-30% | ||
| Monitor Signal Quality | SpO2, Pulse | NA | |
| Data Export | Multiple formats & analog output | 3rd party terminal software | |
| Photoplethysmogram Waveform | Yes - Graphic display and analog output | No | |
Concurrent data sets from both pulse oximeters were imported into Excel. The time base was aligned and data pairs error coded by MouseOx® Plus were omitted. A Bland-Altman assessment and regression analysis were performed on paired data sets to statistically determine their level of agreement.
5. Results
5.1.Rat
The MouseOx® Plus oximeter can be used on both rats and mice (Strohl et al., 2007). Sprague Dawley rats were used in this comparison when blood draws were necessary to establish reference SaO2 measurements with the Stat Profile Prime CSS Analyzer. The value of performing studies of accuracy in the rat is the ability to take arterial blood gas measurements without altering cardiovascular dynamics because of volume changes. Blood draws were spaced out over time to accommodate recovery. In contrast, pulse oximetry allows for continuous monitoring with sample rates up to 15 Hz, is non-invasive and does not cause the need for recovery periods. In this experiment each blood draw took from 20 – 60 seconds to complete. Concurrent values measured by the MouseOx® Plus and MouseSTAT® were averaged over the effective time period. The animal’s SpO2 was held steady for the duration of the blood draw by holding FiO2 constant (values ranged from 12 – 21% O2.). The duration of the blood draw is indicated in Fig. 2 by the length of the red line used to indicate the SaO2 measured by the Stat Profile Prime blood gas analyzer.
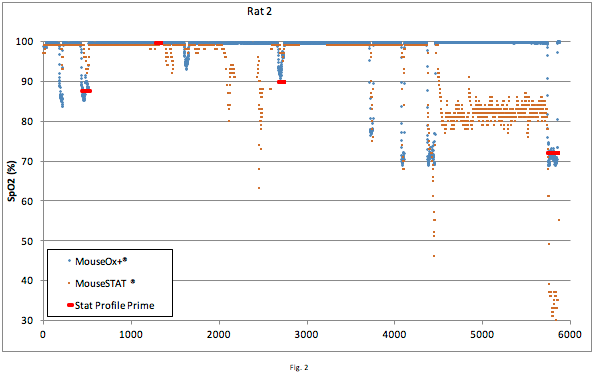
Figure 2: Data pairs containing measurements error coded by MouseOx® Plus were omitted. (note: MoustSTAT® does not monitor signal quality). The data around the red lines (representing the blood draws) is of significant value since direct arterial blood gas measurement (SaO2) is recognized as a gold standard. The first three blood draws show strong correlation between MouseOx® Plus and Stat Profile Prime. The arterial line was flushed with saline @ ~4400 seconds which appears to have adversely affected signal integrity of the MouseSTAT®. Regardless, the MouseOx® Plus data still correlates strongly with the 4th blood draw. The following figures break the recorded measurements into static and dynamic measurements for further analysis.
5.1.1 Static/Steady-State
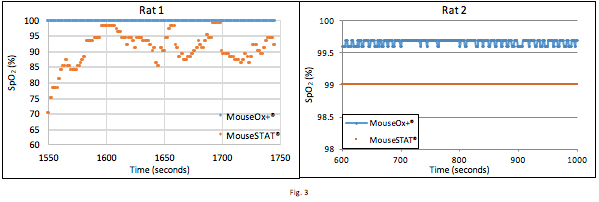
Figure 3 contains data obtained from 2 different rats, configured per the setup described in Fig. 1. During the time depicted the rats were maintained with 1.5% isoflurane and 50% FiO2. MouseSTAT® data for Rat 1 shows low SpO2 with significant variability. During this time the veterinary technician expressed low confidence in the MouseSTAT® readings because they should indicate a pathological state which contradicted observations. The rat did not exhibit discolored mucus membranes or stressed breathing. The data for Rat 2 shows consistent stable readings from both pulse oximeters. MouseSTAT® consistently exhibits a negative offset in static, high SpO2 conditions.
5.1.2. Dynamic Response
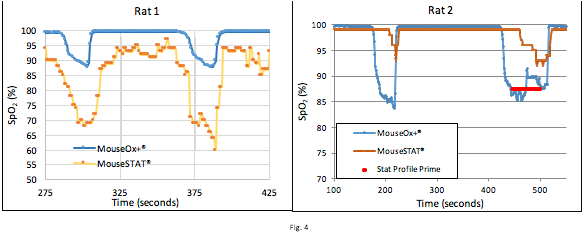
These graphs help illustrate the reliability of the Kent system; in Rat 1, the Kent system was reporting lower than the validated Starr system across two hypoxic events, but in Rat 2, the MouseSTAT® reported higher than the MouseOx® Plus during hypoxic events. The Rat 2 graph also shows the MouseSTAT® reading lower during steady state phases, and did not pick up the hypoxic events until 30 seconds later. Generally, the MouseSTAT® trends with MouseOx® Plus but tends to report lower; however, the Rat 2 graph is an example of how the MouseSTAT® is unpredictable as it can sometimes read higher and react slower than the MouseOx® Plus.
The data from Rat 2 included SaO2% measurements with blood drawn during hypoxic events and concurrent with MouseOx® Plus and MouseSTAT® measurements. The size of the rat permits several collections, and the samples were to confirm results reported for the MouseOx® Plus in the 2007 report. Mice blood draws were decided against because they can only provide 1 sample and have a high probability of expiration afterwards. Blood was drawn from an arterial line placed in the femoral artery below the location of the MouseOx® Plus sensor on the left side. Blood draws were initiated after FiO2 was reduced and the MouseOx® Plus SpO2 reached a steady state plateau. The SpO2 was maintained at this level for the duration necessary to complete the blood draw after which the animal was returned to FiO2 of 50% and SpO2 of 97%-100%. Blood draws were taken concurrently with 3 hypoxic events with SpO2 of: 89.6%, 87.4% and 71.8%. A blood draw was also taken at a baseline SpO2 of 99.6%. A veterinary technician began the process of drawing blood from the arterial line when the animal’s SpO2 readings stabilized. At one point it was necessary to flush the arterial line with saline to clear a blockage.
| Blood Draw: | MouseSTAT® | MouseOx® Plus | Stat Profile Prime |
|---|---|---|---|
| 1 | 96 | 88 | 87.4 |
| 2 | 99 | 99 | 99.6 |
| 3 | 98 | 92 | 89.6 |
| 4 | NA | 71 | 71.8 |
To the left is the table of blood draw data correlated with the averaged data of each system during the drawing time. Kent is close during blood draw 2 but is off by more than 8% SpO2 on blood draws 1 and 3. The MouseOx® Plus matches on blood draw 2, and only 0.76% SpO2 on blood draw 1. Blood draw 3 showed MouseOx® Plus to be off by only 2.4%.
5.2.Mouse
5.2.1 Static/Steady-State
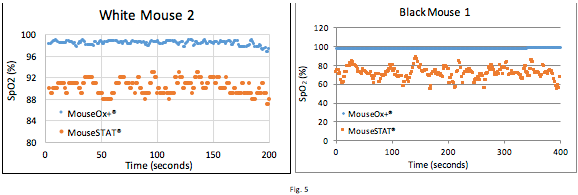
In Figure 5, the mice being measured were at rest with a nose cone supplying Isoflurane and 50% FiO2. The veterinary technician again expressed low confidence in the MouseSTAT® based on observation. The veterinary technician remarked that these animals were breathing fine and were under no duress and would expected SpO2 readings of around 95-100%. Her assessment is based off of years of experience handling research animals with vital sign monitors, and the numbers she provides are rough estimates based on visible physiological factors, such as counting the breaths and observing their intensity (how hard the animal is trying to breathe). The charts show MouseOx® Plus reading around 98%, while the unvalidated MouseSTAT® indicating significantly lower readings with much higher variability. These measurements show that the MouseSTAT® provides unreliable readings for mice at a steady state.
5.2.2.Dynamic Response:
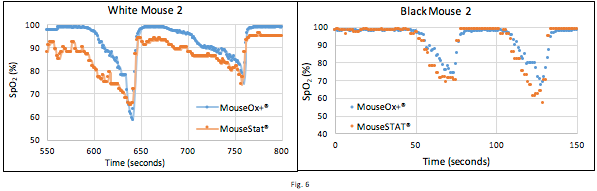
As reported in the Methods section, hypoxic events were induced by changing FiO2 from 50% to a value less than 21% (e.g. 15% FiO2 was used frequently) via a standard gas blender (OxyDial, SLS). On the left, the Kent MouseSTAT® is reading lower than the MouseOx® Plus before the hypoxic event starts. The hypoxic event begins shortly before the 600 second mark. From observing the trends it appears that the Kent system is slightly quicker to react, but it also started off at a lower SpO2 to begin with. The validated MouseOx® Plus readings dip lower than the Kent system at the bottom of the SpO2 curve, but then they agree on way back up to steady state until Kent stops at around 92% SpO2. Kent continues to trend with MouseOx® Plus but reads lower than MouseOx® Plus with higher variability. On the right, the Kent system does agree more with the Starr system at steady state, but reads lower during the hypoxic events. This is a general trend with the MouseSTAT®, where their system trends with the Starr system, but reads lower and with higher variability.
6.Statistical Comparison
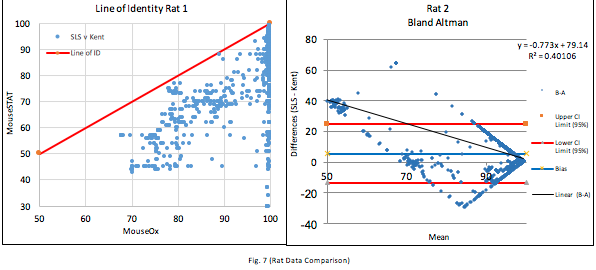
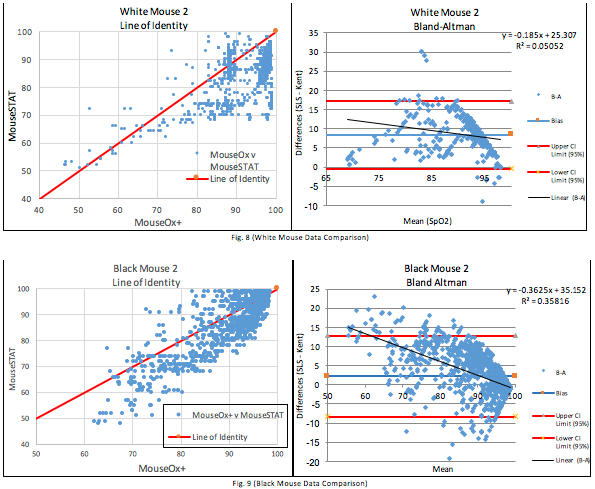
Figures 7, 8, and 9 are the Bland-Altman plots of all paired data sets for each animal. These are accompanied by their respective Line of Identity graph to better visualize the degree of agreement between the two devices. The 95% confidence intervals bands are quite wide. The MouseOx® Plus resolution is <1.5% SpO2 and if these two systems agreed with each other, a reasonable spread (CI Upper – CI Lower) would be lower than two times the resolution of the MouseOx® Plus or roughly 3% SpO2. The spreads found are 17.6%, 21.2%, and 35.5% respectively, and these are a serious indicator that the measurements from the MouseSTAT® cannot be substituted for the validated MouseOx® Plus measurements. The line of identity graphs further illustrates this point, as they show a wide spread around the line of identity.
| Statistical Assessments and Regressions | |||||
|---|---|---|---|---|---|
| White Mouse 1 | White Mouse 2 | White Mouse 3 | |||
| Bias (%SpO2): | 13.3 | Bias (%SpO2): | 8.4 | Bias (%SpO2): | 10.4 |
| Regression Statistics | Regression Statistics | Regression Statistics | |||
| Multiple | R 0.71 | Multiple R | 0.22 | Multiple R | 0.86 |
| R Square | 0.50 | R Square | 0.5 | R Square | 0.75 |
| Standard Error | 6.7 | Standard Error | 4.4 | Standard Error | 5.2 |
| Observations | 411 | Observations | 529 | Observations | 1914 |
| ANOVA | ANOVA | ANOVA | |||
| Significance F | 1.531E-63 | Significance F | 1.75E-07 | Significance F | 0 |
| Intercept Coefficient | 81.71 | Intercept Coefficient | 25.31 | Intercept Coefficient | 129.30 |
| Intercept P-value | 0 | Intercept P-value | 0 | Intercept P-value | 0 |
| Intercept T-stat | 24.05 | Intercept T-stat | 7.91 | Intercept T-stat | 83.22 |
| MouseOx+ Coefficient | -0.76 | MouseOx+ Coefficient | -0.19 | MouseOx+ Coefficient | -1.30 |
| MouseOx+ P-value | 0 | MouseOx+ P-value | 1.75E-07 | MouseOx+ P-value | 0 |
| MouseOx+ T-stat | -20.22 | MouseOx+ T-stat | -5.30 | MouseOx+ T-stat | -76.70 |
| Black Mouse 2 | Rat 1 | Rat 2 | |||
| Bias (%SpO2): | 2.2 | Bias (%SpO2): | 10.2 | Bias (%SpO2): | 5.6 |
| Regression Statistics | Regression Statistics | Regression Statistics | |||
| Multiple R | 0.60 | Multiple R | 0.77 | Multiple R | 0.63 |
| R Square | 0.36 | R Square | 0.59 | R Square | 0.40 |
| Standard Error | 4.4 | Standard Error | 5.8 | Standard Error | 7.5 |
| Observations | 1309 | Observations | 1600 | Observations | 4949 |
| ANOVA | ANOVA | ANOVA | |||
| Significance F | 5.25E-128 | Significance F | 0 | Significance F | 0 |
| Intercept Coefficient | 35.15 | Intercept Coefficient | 85.28 | Intercept Coefficient | 79.14 |
| Intercept P-value | 5.68E-141 | Intercept P-value | 0 | Intercept P-value | 0 |
| Intercept T-stat | 28.71 | Intercept T-stat | 54.16 | Intercept T-stat | 61.73 |
| MouseOx+ Coefficient | -0.36 | MouseOx+ Coefficient | -0.81 | MouseOx+ Coefficient | -0.77 |
| MouseOx+ P-value | 5.25E-128 | MouseOx+ P-value | 0 | MouseOx+ P-value | 0 |
| MouseOx+ T-stat | -27.01 | MouseOx+ T-stat | -47.87 | MouseOx+ T-stat | -57.56 |
Lastly, Table 4 shows the relevant statistics of all paired data sets for each animal. Paired data does not include any error coded data from either system. The Bland-Altman biases calculated for all test subjects ranged from 2.2 – 13.3% SpO2. Such a wide range of bias shows the difference in measurements cannot be explained by a simple offset in measurements. The un-validated MouseSTAT’s average measurement disagrees with the MouseOx® Plus by a significant margin. Next, there are the Multiple R scores ranging from 0.22 – 0.87, which are the absolute value of Pearson’s correlation coefficient. In addition to those, the R Square values range from 0.05 – 0.75. From these two values, it can be deduced that there is weak correlation between the two systems (low Multiple R) and that a minimal amount of variation in the MouseSTAT® is explained by variation in the MouseOx® Plus. The highest significance found is 1.75×10⁻⁷, and the rest are substantially lower or even reported as 0. These findings prove the results found here are all statistically significant. Furthermore, the MouseOx® Plus P-Values range from 0 – 1.75×10⁻⁷, which are indicative of statistically significant relationship between MouseOx® Plus and MouseSTAT®. These findings indicate that the two systems are linked, but their data is poorly correlated with a variable bias.
7. Discussion
An analysis of the Bland-Altman plots demonstrated that the two measurement devices produce significantly different results. Kent’s MouseSTAT® measured two significant digits (##% SpO2), while Starr’s MouseOx® Plus measured three (##. #% SpO2). The absolute value of each bias is greater than 2, meaning the difference in measurement is not due to the lack of significant digits in the measurement devices. The various 95% confidence intervals confirmed these findings. The Regression R Squared values ranged from 0.05 to 0.75, indicating loosely correlated data at best. The results of the Two-Tailed T-tests (Table 4) showed a failure of the null hypothesis (T-stat critical value of 1.96). Analysis of the P-value statistics corroborated this data at the 95% confidence level. The data from the blood draws show that the MouseOx® Plus was ultimately more accurate when measuring SpO2; the MouseOx® Plus was off by an average of 0.7% and the MouseSTAT® was off by an average of -8%. The line of identity graphs showcases how the dynamic response varies wildly, but also shows how the Kent system tends to read lower than the MouseOx® Plus. Appendix A has comprehensive tables of graphs from all the data collected, and they illustrate these findings further. Lastly, the combination of these statistics definitively proved that the Kent MouseSTAT® was not equivalent to the Starr MouseOx® Plus in any significant way, nor was it as accurate based on the blood draw data.
8. Conclusion
Based on the results of several Bland-Altman assessments, the MouseSTAT® measurements are an unsuitable substitute for MouseOx® Plus measurements. The MouseOx® Plus and MouseSTAT® statistically do not agree under steady state conditions or during the detection of hypoxic events. Furthermore, direct arterial blood gas measurements were compared alongside data from both pulse oximeters indicating much stronger correlation to MouseOx® Plus compared to MouseSTAT®. While the MouseSTAT® does seem to trend in the same direction as the MouseOx® Plus, it did not have stability nor accuracy compared to the MouseOx® Plus.
References
Bland J. M., Altman D. G. (1986). Statistical methods for assessing agreement between two methods of clinical measurement. Lancet i, 307-310
Bland J. M., Altman D. G. (1999). Measuring agreement in method comparison studies. Stat Methods Med Res ; 8: 135–60
Fernandez, R., Fernandez, G. (2009). Validating the Bland–Altman method of agreement. SAS Conference Proceedings: Western Users of SAS Software 2009. San Jose, California Retrieved from. http://www.lexjansen.com/wuss/2009/pos/POS-Fernandez.pdf.
FTDI Drivers. (2008). Retrieved May, 2016, from http://www.ftdichip.com/FTDrivers.htm
Kundra, J. (2009, November 06). Free Serial Port Terminal Download. Retrieved May, 2016, from http://www.softpedia.com/get/System/System-Miscellaneous/Free-Serial-Por…
Strohl, K. P., MD, Baekey, D., Ph.D., Dase, S., MS, & Hete, B., Ph.D. (2007, September). Validation of the MouseOx® Arterial Oxygen Saturation Measurements.
Click here to download the PDF of this whitepaper